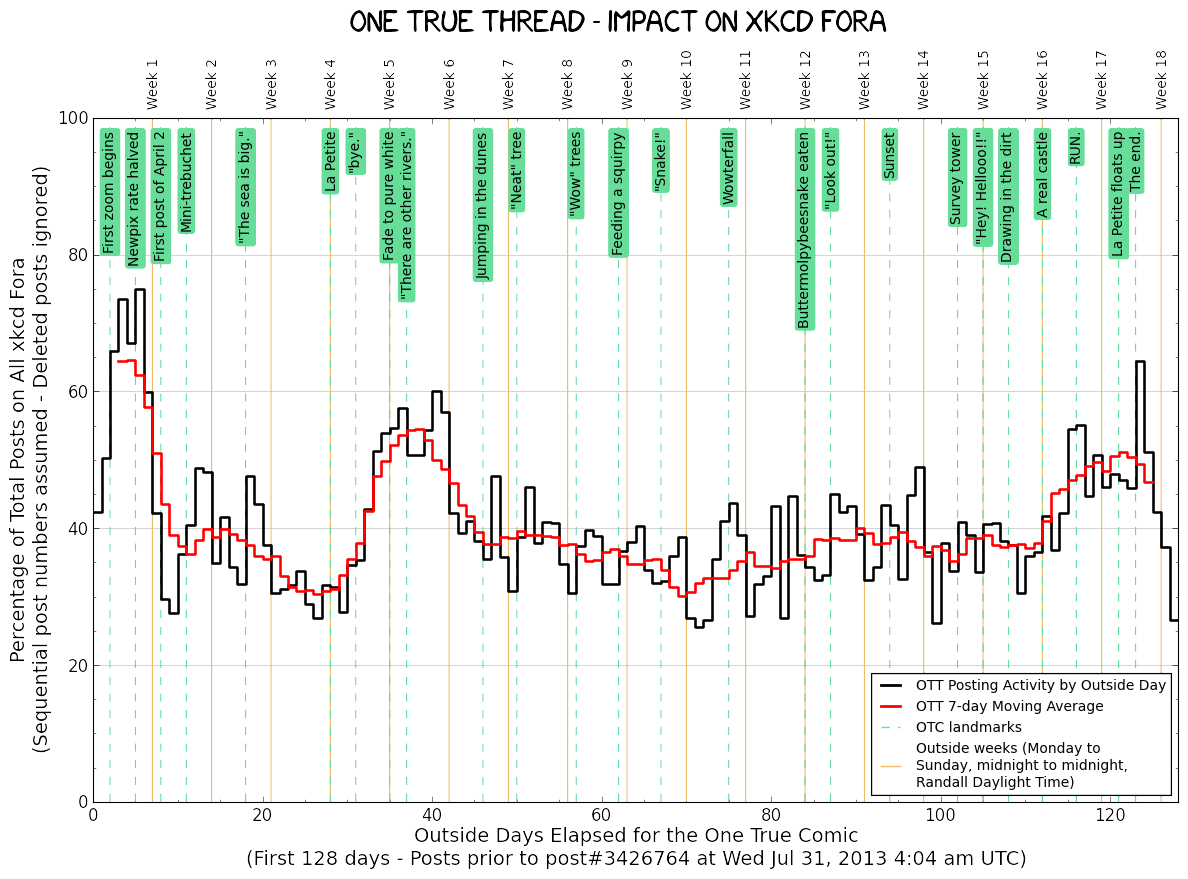
This graph attempts to illustrate the impact the One True Thread of Time has on the overall activity of the xkcd fora. The graph displays, day by day over the course of Time, what percentage of total fora posts are made to the OTT. The black line shows the OTT's daily percentage of total fora activity.
NEW FEATURE: The red line shows a 7-day moving average, to illustrate general trends more clearly; for each day, the activity for the preceding and following three days is included.
The first few days, of course, are the busiest; the first Saturday, when the newpix rate was unexpectedly halved, the OTT spikes to 75% of all fora activity. After the One True Comic does not end on April 1st (the end of Week 1), the OTT shows a big drop, plunging below 30% for the first time. There is a fairish slump during the fourth week before la Petite appears, and another big surge around the Fading and the beginning of the exploration period.
From the seventh to the sixteenth week we bobble along fairly steadily, accounting daily for between 25% and 45% of all xkcd fora activity; the 7-day average stays between 30% and 40%. I don't see any particular pattern corresponding either to weekends or to Othercomic postings, except that Mondays perhaps slump a little more often than other days.
Curiously, no notable increase shows up with the appearance of the Beanies; only after Cueball and Megan begin to talk to Rosetta does the OTT spike above 50%. With Rosetta's bad news about the sea, followed by "RUN," we begin a serious surge for the first time since the Fading, and we spike well over 60% at "The end." The four days after "The end" show a precipitous decline that I hope levels off—but I'll have to wait for it.
Post numbers assigned by the xkcd fora (the "p=" number appearing in the URL when you click on a post title or that little ![]() icon next to the username) appear to be sequential, and unique across the entire xkcd fora system. You can find a post by post number alone, without a thread reference: The post by macraw83 that inspired this graph, post #3402599, is at url http://fora.xkcd.com/viewtopic.php?p=3402599#p3402599. Post #3402600 immediately follows it, but post #3402601 is in the "Create Your Own Nation" thread in "Forum Games", and #3402602 is in the "Multiverse Mafia Day One: Joined Realities" thread of the "Mafia" forum. The sequence of post numbers within the OTT indicates that posts are numbered when they are submitted by the user, not before; posts which are created but never submitted are not numbered.
icon next to the username) appear to be sequential, and unique across the entire xkcd fora system. You can find a post by post number alone, without a thread reference: The post by macraw83 that inspired this graph, post #3402599, is at url http://fora.xkcd.com/viewtopic.php?p=3402599#p3402599. Post #3402600 immediately follows it, but post #3402601 is in the "Create Your Own Nation" thread in "Forum Games", and #3402602 is in the "Multiverse Mafia Day One: Joined Realities" thread of the "Mafia" forum. The sequence of post numbers within the OTT indicates that posts are numbered when they are submitted by the user, not before; posts which are created but never submitted are not numbered.
So I use a simple technique. Subtract the first post number of day n from the first post number of day n + 1, and that's the total number P of posts for day n across all threads on all fora. Directly count the number of OTT posts T on day n. Then T / P is the fraction of day n's fora activity that was generated by the OTT. (This calculation ignores the effect of deleted posts, which, since I'm far too lazy to measure it, should be relatively slight.)
For the moving average, I do the same process, but for each day of the thread I also count the OTT posts and total fora posts for the three preceding and following days. So for day 8 I total days 5-11, for day 9 I total days 6-12, and so on. (The first and last three days are omitted so that each day of the graph has a full 7 days of data.)